The WordPress network viewer is a powerful debugging and security tool built into AdminEase. It provides real-time HTTP request logging, allowing you to see exactly who is connecting to your site, where they are from, what they are accessing, and when.
This feature helps you identify security threats before they become problems, debug connection issues with precision, and gain valuable insights into visitor and bot behavior without leaving your WordPress dashboard.
Why Use a WordPress Network Viewer?
Most WordPress administrators rely on basic frontend analytics or backend server logs to understand their site traffic. However, these traditional methods often miss the hidden background processes that directly impact site performance and security. By utilizing a dedicated WordPress network viewer, you bridge the gap between the two.
For example, if your site is experiencing sudden slowdowns, the live log allows you to instantly see if a specific IP address is spamming your REST API or if a conflicting plugin is generating excessive AJAX requests (admin-ajax.php). Because the log records the precise HTTP response code and request size, you can pinpoint the exact moment a script fails—such as a 500 Internal Server Error or a 404 Not Found error. Furthermore, distinguishing between human visitors and automated bots becomes effortless, allowing you to quickly block malicious IP addresses from probing your site for vulnerabilities.
How to Enable the Network Viewer
- Log in to your WordPress admin panel.
- Navigate to the AdminEase menu and click on the Debug tab.
- Locate the Network Viewer setting and toggle it to the ON position.
- Save your settings to reveal the configuration options and the live log table.
Configuration Settings
Once enabled, you can customize how the tool captures and stores data:
- Maximum Log Entries: Set a limit on how many connections to store in your database (between 100 and 100,000 entries). When the limit is reached, the oldest entries are automatically deleted.
- Auto-Refresh Interval: Choose how often the log table updates automatically (Every 3, 5, 10, 30, or 60 seconds).
- Auto Clear Logs After: Automatically delete logs older than 1 Hour, 24 Hours, or 7 Days to save database space, or set it to “Never”.
- Exclude IP Addresses: Enter specific IP addresses (one per line) that you do not want to track, such as your own office IP.
- Advanced Logging Toggles: By default, standard frontend and admin traffic is logged. You can explicitly enable logging for background processes, including:
- Log WP AJAX Requests (
admin-ajax.php) - Log Cron Requests (
wp-cron.php) - Log REST API Requests
- Log WP AJAX Requests (
- Auto-Load Network Viewer: Automatically load the network viewer log data as soon as the AdminEase page is opened.
Understanding the Log Table
The log displays connections in an easy-to-read table format.
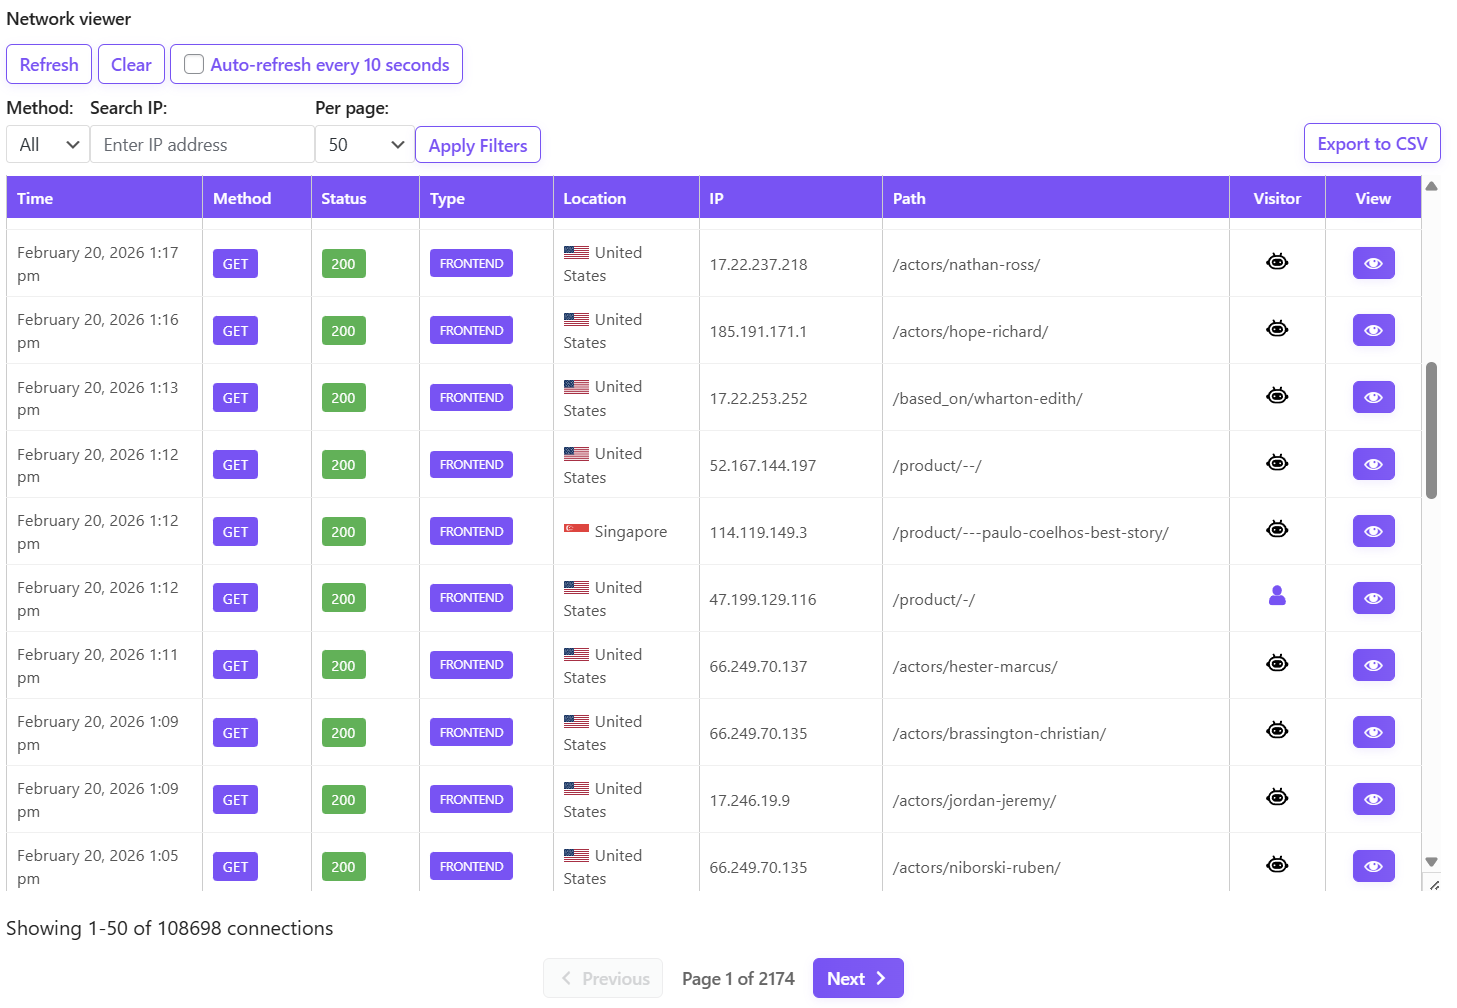
The table columns include:
- Time: The date and time of the request.
- Method: The HTTP method used (e.g., GET, POST, PUT, DELETE, PATCH).
- Status: The HTTP response code (e.g., 200 for Success, 404 for Client Error, 500 for Server Error).
- Type: Identifies if the request was Frontend, Admin, Ajax, Cron, or Rest API.
- Location: Displays the visitor’s country name and flag.
- IP: The client’s IP address.
- Path: The specific URI/page requested.
- Visitor: Displays a human icon or a bot icon based on user-agent detection. AdminEase automatically categorizes known bots and spiders.
Viewing Connection Details
For deep debugging, click the eye icon (View) next to any row to open the Connection Details modal.
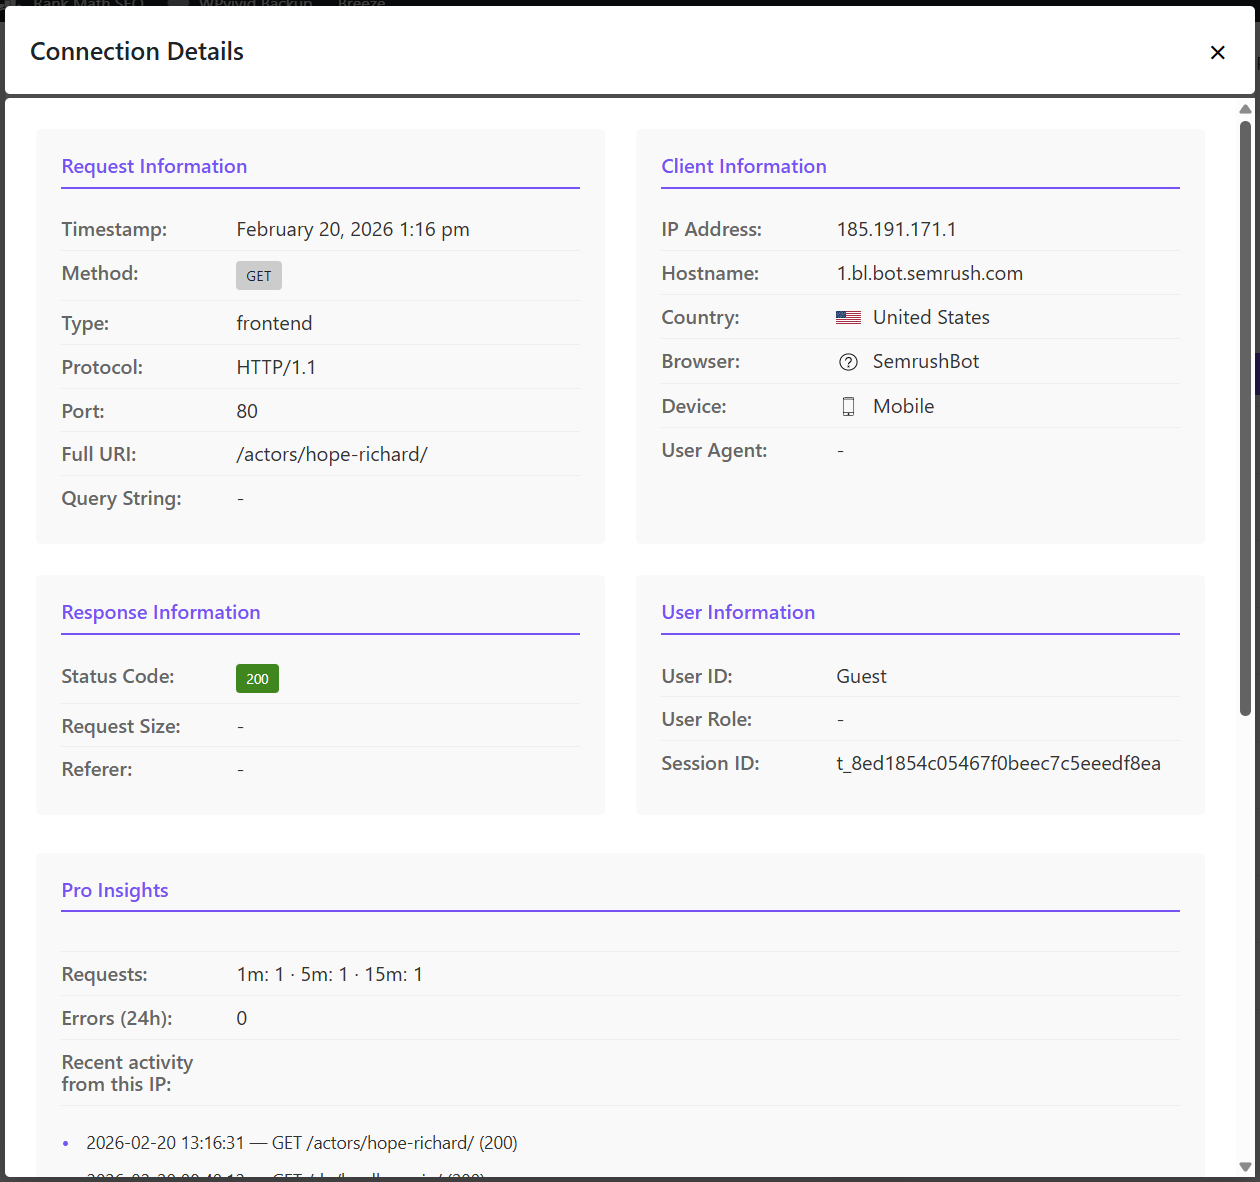
This detailed view provides comprehensive data grouped into four sections:
- Request Information: Includes Protocol, Port, Full URI, and Query String.
- Client Information: Displays Hostname, IP Address, Country, Browser (with icon), Device type (Desktop, Mobile, Tablet), and the full raw User Agent string.
- Response Information: Shows the exact Status Code, Request Size, and the Referer URL.
- User Information: If the user is logged in, it shows their User ID, User Role, Session ID, and a link to edit their profile. If logged out, it will display “Guest”.
Clearing the Log
You can manually delete all recorded connections at any time by clicking the Clear button (requires admin permissions).